


Amazing stats: The state of the Cape
Panning for nuggets in a stream of data

As readers of this space know, I enjoy diving into numbers and economic indicators from time to time. Sifting makes me feel like a bearded prospector panning for nuggets in a rushing stream, teasing out flecks that gleam with implied insights.
So when the Cape Cod Commission and Cape Cod Foundation recently delivered a wheelbarrow of a report to the peninsula’s philanthropic community, filled with intriguing factual chunks, I welcomed the chance to cull, and muse.
Here are some takeaways. Much of this is sourced from the United States census, some from local real estate reports and commission analysis, with my own notes added:
Cape Cod population:
1970: 96,656
2000: 222,230
2010: 215,886
2020: 228,996
NOTES: When a year-round population more than doubles in 30 years, that’s amazing. Even more amazing is that these numbers don’t account for seasonal arrivals, which multiply totals yet again. A small embedded wonder is the dip in population at 2010 with a rebound by 2020. The COVID influx might account for that, but I don’t think the timing is right; seems unlikely a COVID spike would be recorded that quickly. So this wobble in numbers may be better reporting rather than real demographic changes.
Cape Cod total housing units: 164,885
Percent of total housing seasonally vacant: 37.21%
Town with most housing units: Barnstable, 27,452
Town with highest seasonal vacancy rate: Truro, 58.35%
NOTES: The biggest town has the most housing units, that makes sense. The smallest town has the most seasonal residents, which doesn’t necessarily make sense but neither is it weird. There was a brief time when Truro functioned almost like a suburb of Provincetown, attracting year-round fishing families and others priced out of a denser downtown. That was short-lived; no one can call present Truro land values a less expensive alternative to much of anywhere. But handsome homes and vistas remain an attractive Mecca for well-heeled off-Cape soles – I mean souls.
Percent of Cape Cod housing that is single family: 82%
Percent of Massachusetts that is single family: 52%
Percent of USA: 62%
NOTES: As affordable housing initiatives are debated in every town, the question of “character” keeps coming up. Sometimes that’s codeword for wanting to keep certain people out – as in poor, people of color, or even just “strangers.” But often it translates into an environmental concern about multi-family homes that would require us to build up, add on, create density. These comparative stats suggest that the Cape can find places and strategies that allow for a broader housing mix without sacrificing our sense of self, or stomping on the natural beauty that inspires and attracts us. Another way to put it: Single-family home development, also known as checkerboard grid subdivision, also known as suburbia, is not a friend of the environment.
Median sales price for single family homes:
2019 (June): $427,000
2021 (July): $603,000
Percent increase: 41.2%
Average weekly wages:
2019 (June): $930
2021 (July): $1061
Percent increase: 14.1%
NOTES: This is not dyslexia, it really is 41 vs 14 percent. Combining sales prices and wages highlights the disconnect between real estate values and the local economy. We know this already, and lament it, but this ways of exposing the gap is new to me and very dramatic. These are medians and averages, smoothing variation, but the point is clear: Almost no one counting on a Cape Cod wage to buy a Cape Cod home is going to succeed.
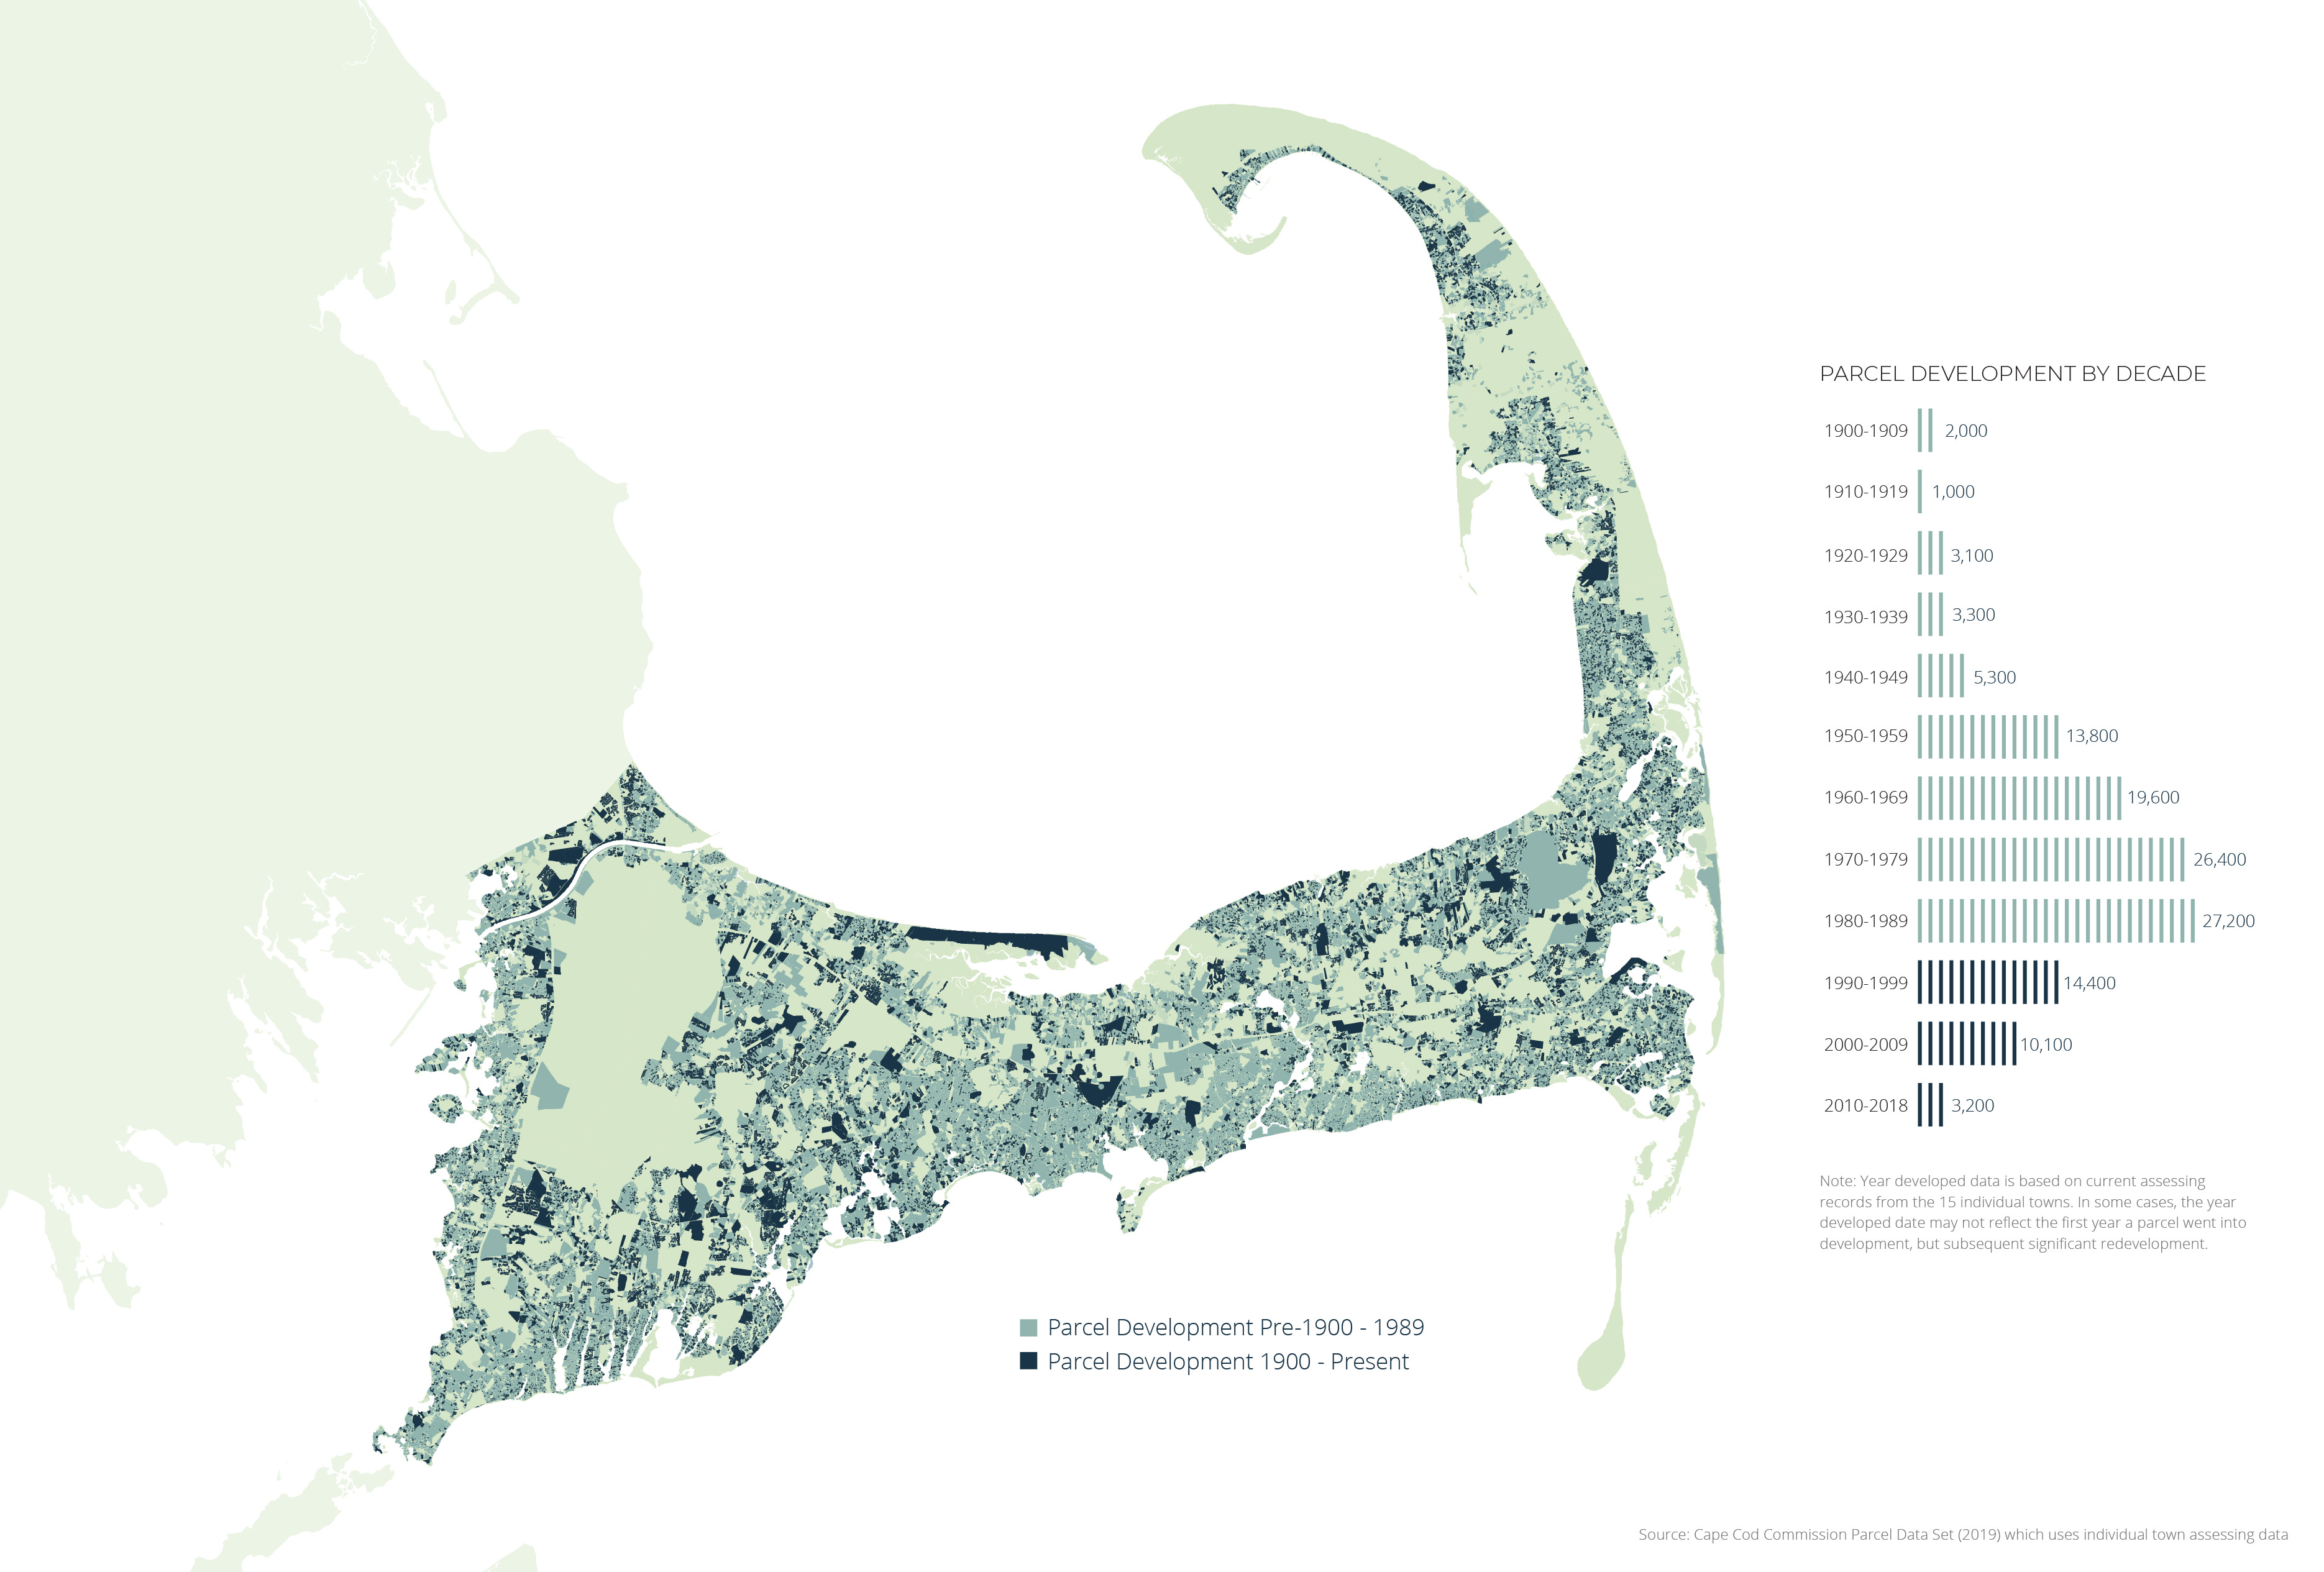
Amount of Cape Cod land protected as open space: 90,000 acres, 40%
Amount left buildable (neither developed nor protected): 14%
NOTES: Two major chunks of open space (in federal and state control) bracket the peninsula, the Cape Cod National Seashore toward the tip and the big military base near the canal — both clearly visible in the map above. Well over 10,000 acres apiece, they still don’t account for 40 percent of our land mass. Towns and conservation trusts have grown that number with sustained, grassroots effort in response to building booms that crescendoed in the 1970s and 1980s. With only 14 percent of land still considered buildable (much of it “marginal”), whatever we want to create for affordable housing, or any kind of construction, will need to focus on rehab, re-use, and conversion rather than clearing open space – unless we decide to repeal generations of land conservation effort.
Total tax-exempt organizations on Cape Cod: 953
Total assets: $5.26 billion
Total revenue: $2.24 billion
Total employees (full and part-time): 17,425
For the top 10 tax-exempts, their percent of revenue: 75%
For the top 10 tax-exempt employers, their percent of jobs: 66%
NOTES: The powerhouse that is the non-profit sector blew me away. How can Cape Cod support 953 non-profits with $2.24 billion in revenue and more than 17,000 employees? Seasonal residents and visitors send a lot of money this way, but even so, over time we can’t. These figures do not even include public entities like towns, the county, or the community college, only organizations that file variations of a form called 990, private non-profits with tax-exempt status. This profound economic driver is top-heavy, focused on only 10 organizations as defined by revenue or jobs. A couple come to mind right away; Cape Cod Healthcare and Woods Hole Oceanographic.
Then came another thought: In cities like Boston, with so much property held by universities and hospitals not required to pay real estate taxes, there has long been a push for those entities to kick in. It’s called PILOT, payment in lieu of taxes. Is it time to pilot that discussion here? Maybe, but even more meaningful might be hard conversations about how our amazing spread of non-profits could find ways to join forces without losing impact or mission, continue to serve with less overlap or duplication. Then again, pondering these possibilities, I see what looks a lot like a pie in the sky.
If you’d like to put on your own spelunker’s hardhat and see the full report, here:
https://barnstablecounty.sharepoint.com/:b:/g/dept/commission/team/comm/EWOgRnDA0IdMq3TldajqLQ0B2AeAYA8LUsxe5_HJK60JOQ?e=ebsEq4
Haven’t subscribed yet? To keep seeing a Voice (a cool trick), please support this local expression:
953 nonprofits are an awful lot. Delving deeper, you might find the majority are family trusts with 0 or 1 employee.
Could you identify the top 10-20 in terms of employees or income or assets?
Do any of the large ones make payments-in-lieu-of-taxes ("PILOT") to the towns where they are located? Everyone else pays higher taxes if they do not.
Are any of them helping with the Cape's crisis in housing--either for their own employees or for the larger community?
I love crunching numbers like this to Seth. Nice job.
Conservation land like Nickerson and the seashore are getting built on.
From yurts to high school to roads and road “ improvements “ it’s a fallacy to count many large tracts of land as “conservation “.
The large sums of cash that come on cape is from retired folks- especially those who have lost their husbands and open savings accounts with no knowledge about investing. Also the feds drop vast sums of social security benefits here too.
Interesting to think about how we keep it attractive and not a suburban area. Hyannis is considered urban area and much of the remaining cape is viewed as suburban- according to us Bureau of Census SMSA’s.